CPG brand on Amazon
Type CPG Store Amazon Time 3 months

We grew this brand from $677K to $947K a month.
And made 53% more profit.

This CPG brand had big sales but small profit. Too much money went to ads. In 90 days, we grew sales 39.7%, cut ad spend as a share of sales, and grew profit 53%.

Monthly sales
+39.7%
$677,760$947,087
Profit
+53.0%
$193,345$295,877
Ad spend, month 1
−19.6%
Month one, while profit rose 40%
The 90-day story

Four months. Each one beat the last.

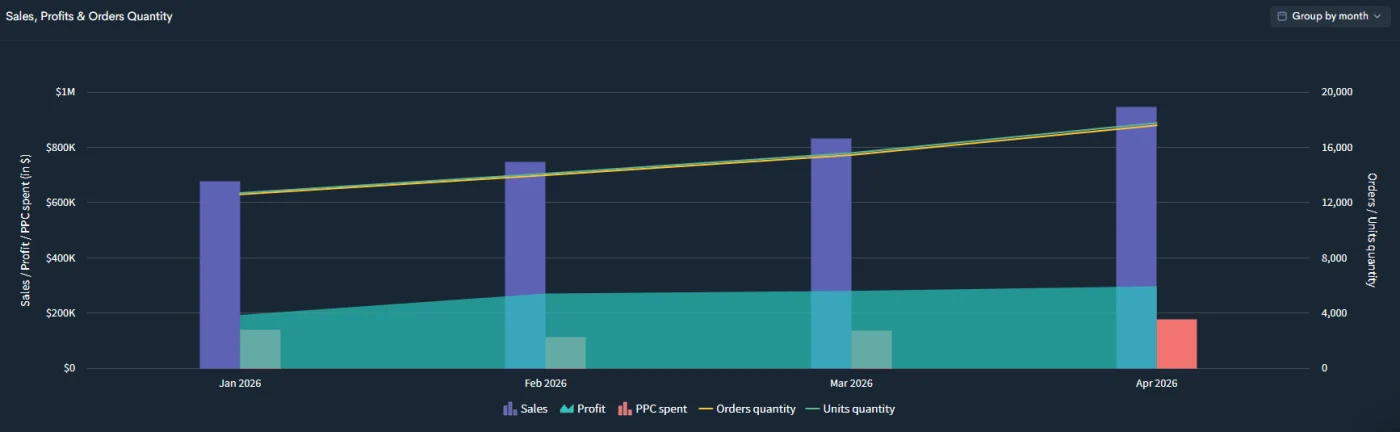
Each month beat the one before it. Sales and profit went up. The share of money going to ads went down.

Monthly sales
$677K $747K $833K $947K JANFEBMARAPR
Sales grew 39.7% from January to April 2026.
Profit
$193K
Jan
$271K
Feb
$280K
Mar
$296K
Apr
Profit grew from $193K to $296K a month. That is 53% more.
Where they started

Big sales. Small profit. Hard to find.

The brand sold over $677K a month, but ads ate up 1 in every 5 dollars. Their top search word gets 690,000+ searches a month, and they ranked #101 or lower for it. They were paying for growth with ads instead of earning it.

#101+
Their rank for their main search word at the start
690K+
People search that one word every month
20.9%
of sales was going straight to ads
28.5%
Starting profit margin, with room to grow
What we did

We fixed the whole Amazon listing at the same time.

Ads were the last thing we touched. First the page, the images, and the search terms.

01
Rewrote the page to rank
We rewrote the product page so it shows up higher when people search on Amazon, and so Amazon’s AI shopping assistant points buyers to it.
02
Added smart Q&As
We added clear questions and answers on the page, so shoppers get a quick yes when they check if it is right for them.
03
Cut wasted ad spend
We stopped paying for ads that did not work and moved that money to ads that did. Profit went up while ad spend fell as a share of sales.
04
New photos
We rebuilt the main photo and the color options so more shoppers click and buy.
05
Better page content
We added a fresh brand story and richer content so shoppers trust the brand and buy more.
06
Weekly tune-ups
Every week we improve the page, photos, and ads. So the results keep growing month after month.
The first 30 days

Month one alone: 40% more profit.

Before month two even started, things had already turned around. More sales, a lot more profit, and far less spent on ads.

#101 → #5
Jumped up the rankings for their main search word
+40.0%
More profit than the month before
−19.6%
Less ad spend, more sales
+160%
More shoppers reached from top-10 spots
+1,171%
More shoppers reached from top-50 spots
+10.3%
More total sales than the month before
Getting found

Top-50 reach went from 228K to 2.9M. We earned it.

This shows how many shoppers could find the brand in search. In one month, the number who could find it in the top 50 grew more than 12 times over.

Shoppers reached · top-10 spots
205K
Before
532K
After
160% more shoppers reached each month from top-10 spots.
Shoppers reached · top-50 spots
228K
Before
2.9M
After
From 228K to 2.9M shoppers reached. That is more than 12x as many.
The P&L

Every line. Four months.

Four months of their Amazon P&L, line by line.

Monthly Amazon profit and loss for the brand, January to April 2026.
Line / monthJan 2026Feb 2026Mar 2026Apr 2026
Sales$677,760$747,349$832,786$947,087
Cost of product−$118,851−$123,532−$136,745−$157,201
Ad spend−$141,724−$113,967−$138,603−$179,828
Amazon fees−$159,884−$170,814−$190,745−$217,794
Taxes−$46,871−$51,864−$57,936−$65,914
Refunds−$29,642−$31,459−$35,199−$36,744
Other Amazon income+$12,557+$15,068+$6,877+$6,271
Profit$193,345$270,781$280,435$295,877
Profit margin28.53%36.23%33.67%31.24%
Ad spend grew with sales but fell as a share of them, from 20.9% in January to 19.0% in April. Numbers come from the brand’s Amazon profit reports. The brand’s name is kept private.
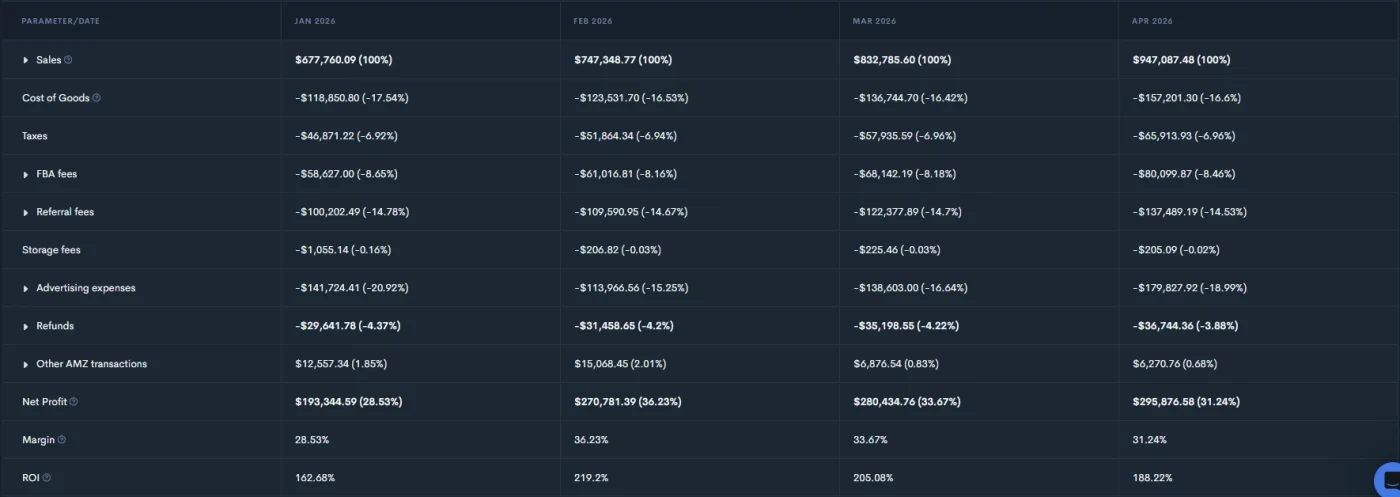
Monthly Amazon profit and loss dashboard, January to April 2026, sales $677,760 to $947,087
The source · monthly P&L dashboardJan $677,760 → Apr $947,087 · net profit $193K → $296KThe same month-by-month figures as the table above, pulled straight from the brand’s profit dashboard. The dashboard carries no branding, so the brand stays private.
Sales, profit and PPC spend by month, January to April 2026, sales rising toward $947K
Sales, profit and ad spend · by monthSales climbing to $947K while profit outpaced itSales, net profit and PPC spend, January to April 2026. Profit grew faster than sales as ad efficiency improved.
Your brand next

Two brands a quarter.

Most brands that ask are not a fit. Book the call and we will show you where your Amazon sales and profit are leaking, and what your first 90 days could look like.

You get your listings, rank, and ad waste mapped. Yours to keep either way.