The P&L
Every line. Four months.
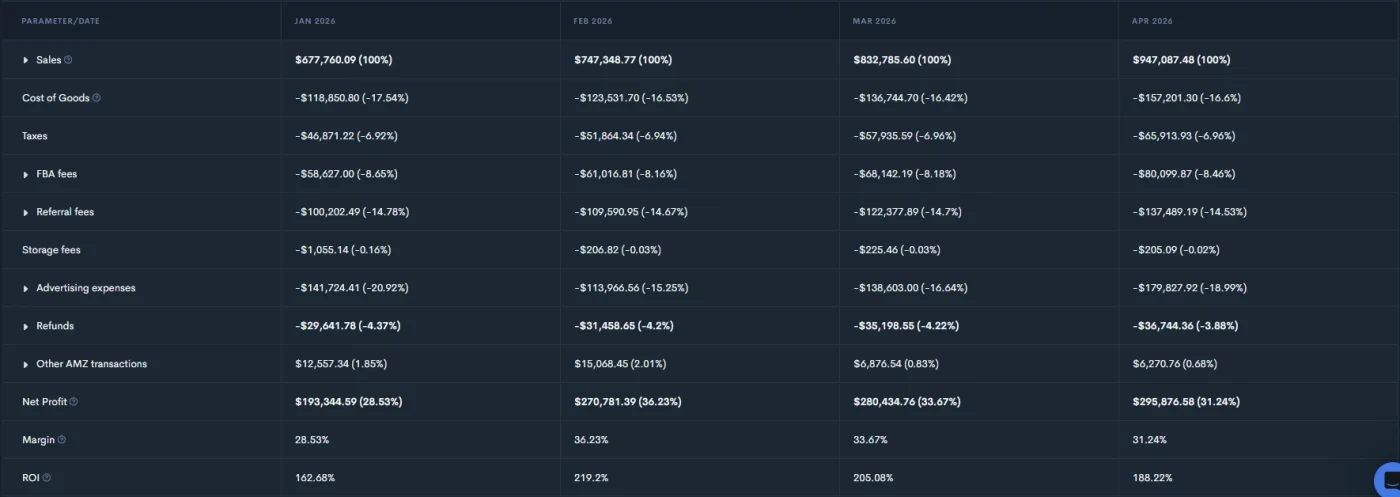
Four months of their Amazon P&L, line by line.
| Line / month | Jan 2026 | Feb 2026 | Mar 2026 | Apr 2026 |
|---|---|---|---|---|
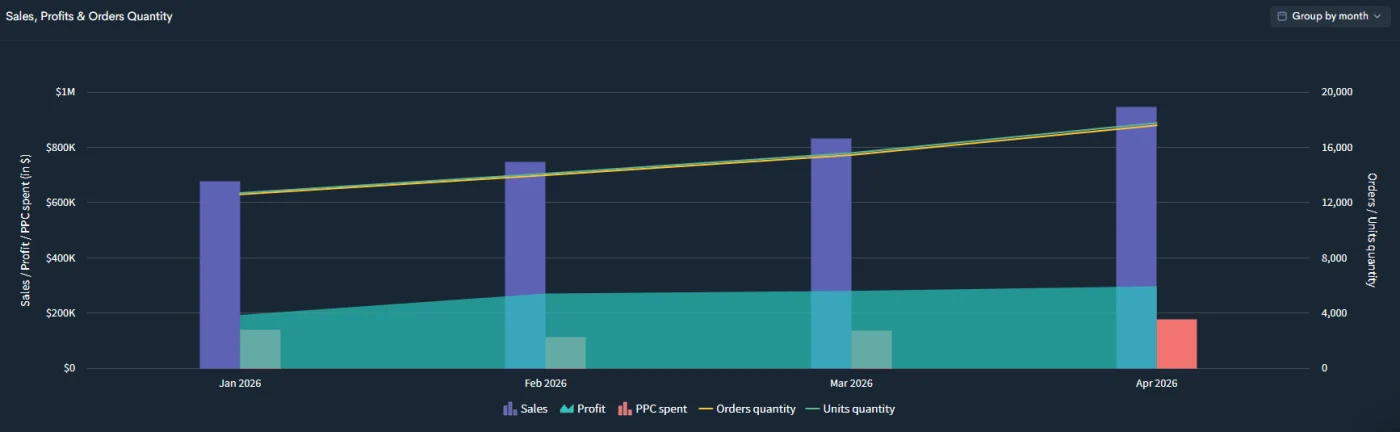
| Sales | $677,760 | $747,349 | $832,786 | $947,087 |
| Cost of product | −$118,851 | −$123,532 | −$136,745 | −$157,201 |
| Ad spend | −$141,724 | −$113,967 | −$138,603 | −$179,828 |
| Amazon fees | −$159,884 | −$170,814 | −$190,745 | −$217,794 |
| Taxes | −$46,871 | −$51,864 | −$57,936 | −$65,914 |
| Refunds | −$29,642 | −$31,459 | −$35,199 | −$36,744 |
| Other Amazon income | +$12,557 | +$15,068 | +$6,877 | +$6,271 |
| Profit | $193,345 | $270,781 | $280,435 | $295,877 |
| Profit margin | 28.53% | 36.23% | 33.67% | 31.24% |
Ad spend grew with sales but fell as a share of them, from 20.9% in January to 19.0% in April. Numbers come from the brand’s Amazon profit reports. The brand’s name is kept private.